Introduction
Dashboards are customizable canvas that enable your team to visualize status and monitor progress across your VSTS or TFS project. They replaced the previous Team Overview page. Using dashboards you can bring life to your project. VSTS Team uses its own product and releases updates to this platform in a 3-week cycle. In this blog post, I am going to give you a short overview about how the dashboards used to look previously, and how they look now and what new features have been added to make the dashboards more efficient. You can also visit Visual Studio website to learn more about Dashboards, Team Dashboard, How to add a dashboard widget and How to add a chart to dashboard.
If you would like to learn more about what is the story behind containers and what drives or the needs for it, have a look at the this post. We will know why companies moved from traditional solution architecture to Microservices and how this put containers as the perfect solution for running them, we will get a quick intro to clear some definitions, tools and keywords related to this ecosystem. For example, we will understand the difference between VM, Container, and Hyper-V Container, why we would prefer container over VM and when the VM is better. We will understand the difference between container and image and know the life cycle of creating a new image and why I do that, like adding more layers to the base image, push that to container images registry on the cloud, then pull that from the registry to anywhere to have a new container. We will understand also different technologies and services around containers, like Docker, Docker Swarm, Kubernetes, Azure Container Services (ACS), Azure Container Registry, etc.
You can see this video, if you would like to find more information about how to debug a Microsoft Dynamics 365 CRM Plugin project. Learn how to put a breakpoint and attach the process to the debugger. We will attach w3wp.exe which is the process of IIS. And the second process is microsoft.crm.sandbox.worker process.exe. Create a new account on CRM and learn where you can see the activities related to the debugging (next to the summary of your account, in the activities tab).
Dashboards - Previous Version
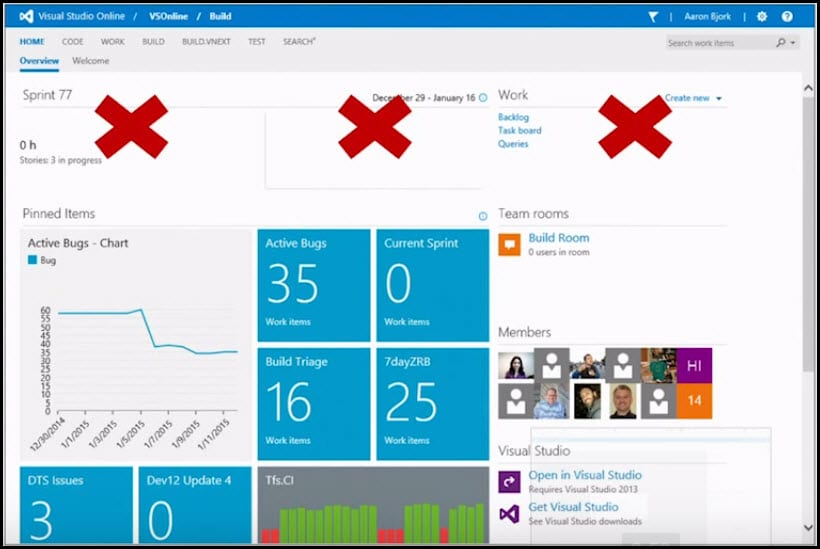
On the previous homepage, you could only have one dashboard, you could only have a small section for new widgets and you couldn't customize anything else on that page. You couldn't remove any of the widgets and you couldn't lay it out the way your team wanted. The image below shows the old team overview page inside VSTS. The image is showing some of the features that you couldn't customize in order that dashboard would fit your project's needs. You could not remove the top blocks if you do not want them there. If your team didn't use or burn down the capacity, there was no way to remove them.
If you would like to learn more about Hockey App as it's part of Microsoft's Mobile DevOps stack helping developers manage the app lifecycle and automate integration, testing, delivery, and monitoring. Mobile Center is a new base for all of your mobile application needs. It is a set of DevOps tools including continuous integration, automated UI testing, distribution, crashes and analytics. You can use any number of these features independently, but the more you combine, the more powerful Mobile Center becomes. - have a look at this post.
If you would like to learn more about how to work with SSRS PowerShell so we can remap SSRS or SQL Server Reporting Server Database to an existing DB, we will see also how to restore SSRS encryption key - have a look at this post.
Dashboards - New Version
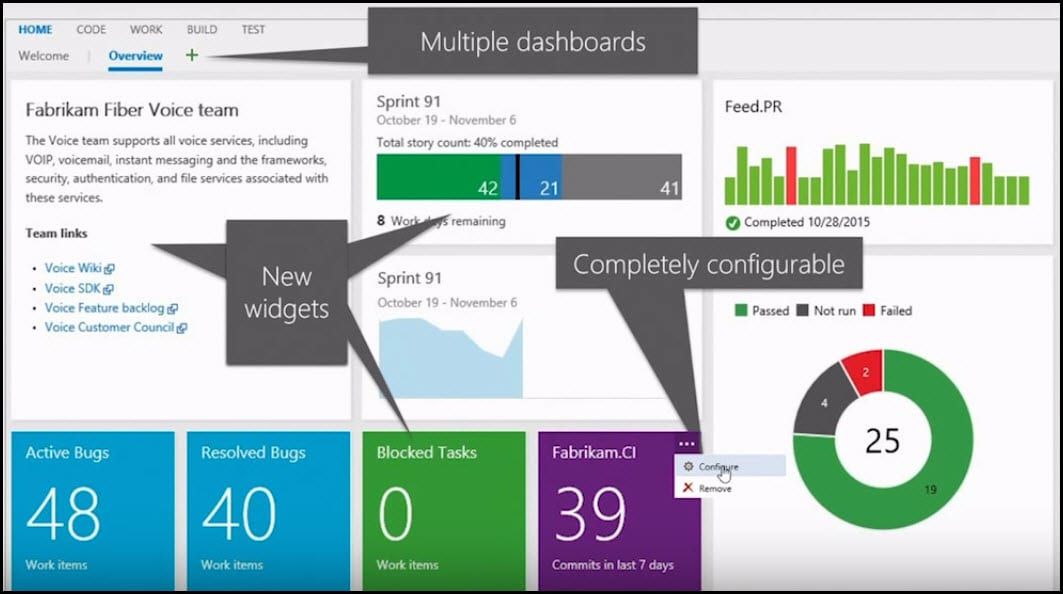
Features of new dashboard allow users to customize so much more in order to show data which is showing in the best way the progress of their project. In the new dashboard, you can have multiple dashboards. Every single widget on the dashboard is hundred percent customizable so you can remove, add, or configure any widget the way you want. The image below shows what the new dashboard looks like. If you are a team admin on the page you will start to see that there is a green + button. That plus button allows you to add multiple dashboards. Another thing that you will see is that if you hover over any widget, you can start laying them out the way you want or you can configure them to show the data you want.
One more thing that you will see are the new widgets.
Three of them are shown here. One of them is a markdown widget and it really lets you be creative in a way what you want to show your team: text, images or links. The other one is the sprint overview widget that allows you to see stories that are in progress and which ones haven't started yet. The last widget you will see in green is the query tile (the query tile can turn red or green depending on the threshold of bugs). And it triggers green because there are no blocked tasks on this board.
If you would like to learn more about how to change the credential of IIS Application Pool using PowerShell, we will also use PowerShell to restart the Application Pool - have a look at this post.
[More Info]{.ion-info} If you would like to learn more about how to use PowerShell to change some values for Microsoft Dynamics 365 - have a look at this post.
Conclusion
The new features that have been added to dashboards can really help you to keep your team in sync and also provides improved visibility. See these additional resources to help you support your team:
Also, you can create a dashboard widget using the REST API service.
If you would like to learn more about how to create new Dynamics 365 CRM environment locally with Windows Server 2016 Standard Edition, then prepare this machine to be ready to upload to the cloud (Azure), then upload the machine to Azure, then create an image of that machine, after that, we will start using this image for creating new virtual machine with Dynamics 365 then reconfigure the machine to fix all the problems because changing the hard disk and the machine name which will make problem for SSRS (SQL Server Reporting Server), all IIS application pools crashed, the SQL Server name crashed, and of course Dynamics 365 CRM doesn't work, so I will show exactly how to solve all those problems so we can have a new copy of an existing Dynamics CRM machine and make it works fine - have a look at this post.
You can see this video, if you would like to find more information about how to write and run unit tests for Microsoft Dynamics 365 CRM Plugin project using Microsoft Fakes and FakeXRMEasy and integrate them with Visual Studio Team Services build. First, I am going to create a fake context with input and output parameters and execute the plugin using them. FakeXRMEasy is easy and simple since it is based on reflection. In order to work the task properly you need to create an entity “task” and have the Proxy Classes that previously should be added to the project. Using Microsoft Fake, you need to add changes to the code. First, you need to add reference to Microsoft.Xrm.Sdk and after that add Fakes Assembly then start writing your test.


